


Narrow-linewidth lasers are increasingly sought after for their remarkable low frequency noise and high temporal coherence, making them indispensable in advanced applications such as high-resolution spectroscopy, long-range fiber sensing, and coherent light detection and ranging (LiDAR). Their ability to deliver precise, stable outputs has propelled their adoption across industries requiring fine optical control. However, as these lasers become more prevalent, accurately characterizing their performance has grown more critical—and more complex. Conventional tools, such as grating-based optical spectrum analyzers (OSA), often fall short of the resolution required to assess these lasers’ narrow emission spans, which typically range from the kilohertz spectrum down to a few tens of hertz. Consequently, advanced techniques, such as the selfheterodyne method, are commonly employed to evaluate their linewidth. Despite its ubiquity, relying solely on linewidth to summarize laser performance can be misleading, as it often oversimplifies the nuanced factors that impact laser quality. A more comprehensive metric, such as the power spectral density of frequency noise (PSDFN), provides a more accurate depiction of laser characteristics over a broad frequency range.

Specifying Linewidth: Methods and Metrics
Linewidth is a widely used figure of merit for lasers, describing the spectral width of their output. It represents the finite width of a laser’s emission spectrum, caused by fluctuations in optical phase and frequency due to intrinsic quantum noise and external noise sources. Despite its widespread adoption, linewidth measurement is not as straightforward as it seems, as various factors influence the value, including observation time and environmental conditions. The Schawlow–Townes equation provides a foundational framework for calculating the intrinsic linewidth of a laser. This equation assumes that the linewidth is solely limited by quantum noise originating from spontaneous emission. The intrinsic linewidth is given as:
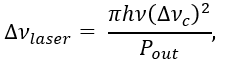
where hv is the photon energy, Δνc is the resonator bandwidth and Pout is the output power1. However, real world lasers are subject to additional noise sources, such as temperature fluctuations, mechanical vibrations, and electronic noise, which broaden the linewidth beyond this
theoretical limit.
Two prevalent methods for specifying linewidth include:
1. The Instantaneous Lorentzian Linewidth:
This method calculates linewidth by evaluating the highfrequency limit of the PSDFN, assuming a purely Lorentzian spectral shape dictated by quantum noise. The Lorentzian lineshape is characterized by a constant noise floor at high frequencies. The instantaneous linewidth is then derived from this noise floor. This approach is simple, quick, and computationally efficient, making it the most commonly reported metrics in commercial data sheets. However, it comes with significant limitations:
Neglect of Low-Frequency Noise: Low-frequency noise, caused by environmental or technical factors such as temperature drifts, mechanical vibrations, and electronic instability, can dominate in many practical applications but is ignored in this method. For instance, lasers used in highprecision sensing applications like fiber optic strain sensing or temperature monitoring are highly susceptible to low-frequency noise, which affects their stability and accuracy. Additionally, in long-range fiber sensing, low-frequency noise contributions can significantly degrade the signal-to-noise ratio over extended observation times, making the performance of lasers less predictable and more application-dependent. Ignoring these contributions may lead to underestimating the impact of noise on systems requiring stable and reliable outputs over long duration.
Observation Time Dependency: The instantaneous linewidth does not account for how linewidth changes with observation time, leading to discrepancies in applications requiring long coherence times. For instance, in frequency modulated continuous-wave (FMCW) LiDAR, observation times are typically limited to the duration of a single frequency ramp, ranging from 10 μs to 1 ms. This range emphasizes the mid-frequency components of the power spectral density of frequency noise (PSDFN), directly influencing the effective linewidth. Conversely, applications such as distributed acoustic sensing (DAS) and temperature or strain sensing often require longer observation times—sometimes in the milliseconds range—to improve accuracy, making these systems more affected by lowfrequency noise contributions. Understanding the observation time and its corresponding frequency range is essential for tailoring laser specifications to specific applications and ensuring reliable performance.
Neglect of PSDFN Deformations: Modern laser systems increasingly incorporate feedback loops to actively suppress noise, particularly in the low-frequency domain. This approach significantly improves laser stability and performance for demanding applications. However, these control mechanisms can introduce distinct features in the Power Spectral Density of Frequency Noise (PSDFN), such as localized peaks or spectral shaping resulting from servo responses. Traditional linewidth metrics, however, often overlook or misrepresent these features, providing an incomplete picture of the laser’s noise behaviour. For applications like coherent LiDAR or precision metrology, where sensitivity to specific frequency bands matters, understanding these spectral features can ultimately lead to better system optimization and performance.
2. The Beta-Separation Line Method:
This method, discussed extensively by Di Domenico et al. (2010)2 and validated experimentally by Bucalovic et al. (2012)3, provides a more nuanced approach to understanding linewidth by separating the frequency noise spectrum into two distinct regions using the beta-separation line. The beta-separation line acts as a threshold, distinguishing frequency components that contribute to the laser’s linewidth from those that do not. In the region above the beta-separation line, slow frequency modulations dominate, directly affecting the linewidth by broadening the laser’s spectral profile. Conversely, in the region below the line, fast frequency modulations contribute only to the wings of the spectral profile and do not influence the core linewidth.
One key advantage of this method is its ability to identify the frequency noise contributions that significantly impact linewidth, enabling a clearer understanding of how different spectral components interact with laser performance. Instead of relying on complex numerical integration, this method simplifies linewidth determination by calculating the area under the relevant portion of the frequency noise power spectral density. This makes it computationally efficient and less prone to artifacts.
Experimental results presented by Bucalovic et al. (2012)3 demonstrate the accuracy of the beta-separation line method across a wide range of linewidths, from kilohertz to megahertz, and for different laser line shapes. By applying this method, researchers were able to validate its consistency with actual linewidth measurements obtained using spectrum analyzers, proving its versatility for various laser systems.
Despite its strengths, this method has limitations when applied to ultra-narrow linewidth lasers.
The Gaussian Contribution Becomes Negligible for Narrow Linewidths: In lasers with ultranarrow linewidths, the frequency noise spectrum is often dominated by high-frequency quantum noise, while contributions from lower-frequency Gaussian components are minimal or even negligible. The beta-separation line method relies on distinguishing between slow modulation (Gaussian) and fast modulation (Lorentzian) regions of the noise spectrum. However, when the Gaussian contribution diminishes, as is often the case for narrow linewidth lasers with excellent stabilization mechanisms, the method defaults to analyzing the Lorentzian region alone. This can result in oversimplified characterizations of the laser’s spectral profile, as the method may fail to account for subtle noise features or environmental influences that still affect the laser’s overall performance. This limitation is particularly problematic in applications requiring precise noise modelling, such as high-resolution spectroscopy or optical frequency metrology, where even small noise contributions outside the Lorentzian regime can degrade system accuracy. Additionally, while it accounts for observation time to some extent, its accuracy diminishes when observation times exceed the range where slow modulations dominate.
Accounting for Observation Time: The betaseparationline method incorporates observation time to determine which frequency noise components contribute to the linewidth, but this is done in a limited way. Observation time directly impacts the extent to which low-frequency noise contributes to the laser’s linewidth. For example, longer observation times allow for greater integration of slow frequency fluctuations, broadening the effective linewidth. While the beta-separation line introduces a cutoff to handle this dependency, its approach lacks the flexibilityto fully model observation-time-dependent noise dynamics. For ultra-stable lasers, where 1/f noise dominates at low frequencies, the fixed cutoff imposed by the method might exclude important noise components that significantly affect the linewidth over longer observation periods. This limitation can lead to discrepancies between calculated and observed linewidths in applications requiring extended coherence times, such as distributed acoustic sensing (DAS) or high-precision interferometry. A more nuanced treatment of observation time would be required to accurately capture the interplay between low-frequency noise and linewidth broadening in these scenarios.
Both methods, while useful for initial comparisons, often fall short of capturing the full spectral complexity of narrow linewidth lasers. The choice of method depends on the specific application and the type of laser being analyzed.
The Limitations of Linewidth as a Specification and the Case for PSDFN
The power spectral density of frequency noise (PSDFN) is a comprehensive metric for evaluating the performance of narrow linewidth lasers. Unlike linewidth, which offers a simplistic representation of laser behaviour, PSDFN quantifies frequency noise across a wide range of frequencies. This approach provides critical insights into the intrinsic and extrinsic noise contributions affecting a laser’s stability and coherence. By integrating the PSDFN over an appropriate observation time, one can accurately reconstruct the spectral shape of a laser, offering a more detailed understanding of its performance.
The PSDFN, given by Sν(f) and expressed in units of Hz2/Hz, is a measurement of the noise in the instantaneous frequency of a laser per frequency unit over a range of frequencies. It can be measured through several methods, most of them using an interferometer with a path delay difference of τ to convert the frequency noise into an intensity noise easily detectable by a fast photodiode.
Centered around zero, the laser spectral shape, given by Se(f), from which the laser linewidth can be computed using the full width at half maximum value (FWHM), is linked to Sν(f) using the following set of equations4,5:

Note that the value of

represents the degree of coherence of the laser.
Those equations are valid when the interferometer output used for the evaluation of Sν(f) is averaged over an infinite period. Under real operating conditions, the observation time will be finite. This has a significant impact on the measured frequency noise, and thus, the spectral shape of the laser. Indeed, whereas frequency noise attributed to quantum fluctuations will remain constant, the noise from environmental or thermodynamic perturbations at lower frequencies will increase significantly with measurement time, leading to a wider equivalent linewidth and a shorter coherence length.
At a finite observation time Tobs, H(f) filters Sν(f) according to the following equation6:

Where:

Applications requiring a long observation time will therefore be more impacted by low frequency noise than those requiring short observation times.

The PSDFN can then represent a laser behaviour with much more nuance by including more information over the spectrum of frequencies. Several factors highlight its benefits.
- Dependence on Observation Time: Linewidth values derived without considering observation time can vary significantly. Environmental and thermal noise contribute to frequency noise at lower frequencies, which broaden the effective linewidth over longer observation periods. This effect is especially pronounced in applications requiring extended coherence times. For instance, indie’s LXM-U laser demonstrates this behaviour: its calculated linewidth reduces dramatically from 2.1 kHz at a 30 ms observation time to just 46 Hz at 1 ms. This stark difference highlights the importance of aligning linewidth specifications with application-specific timeframes.
- Ability to Represent Complex Noise Profiles: Lasers often exhibit noise profiles beyond the simplistic Lorentzian or Gaussian models, such as those influenced by frequency locking to optical references. For example, the LXM-U’s noise profile, shaped by advanced frequency locking, achieves a white noise floor below 5 kHz Fourier frequency, which is notably lower than many comparable lasers. This unique profile enables superior performance in applications sensitive to mid-range noise, such as fiber optic sensing systems.
- Application-Specific Sensitivities: Different applications emphasize distinct portions of a laser’s spectral characteristics. Frequency-modulated continuous-wave (FMCW) LiDAR benefits from lasers with minimal noise over short observation times, whereas temperature and strain sensing prioritize stability over longer duration. The LXM-U laser, with its exceptionally low noise across a wide frequency range, demonstrates versatility in meeting these diverse requirements.
The PSDFN offers a far more detailed representation of laser behaviour. The PSDFN quantifies frequency noise across a range of frequencies, providing insights into both intrinsic and external noise contributions, such as quantum noise, environmental perturbations, and mechanical vibrations. This detailed analysis allows for the identification of noise sources specific to particular frequency ranges. For instance, low-frequency noise often stems from thermal or mechanical instabilities, while high-frequency noise may be dominated by quantum effects. When integrated over an appropriate observation time, the PSDFN can reconstruct the laser’s appropriate observation time, the PSDFN can reconstruct the laser’s spectral shape, providing critical information about coherence length and stability. This capability makes PSDFN invaluable for applications such as coherent LiDAR, where noise within certain frequency bands directly impacts resolution and accuracy. Moreover, PSDFN analysis enables precise tailoring of lasers to specific applications by highlighting areas where performance improvements can be targeted.
The PSDFN from different lasers is shown in Figure 2. They all exhibit different behaviors in different frequency ranges. The Beta separation line is also shown. Points above the line will be integrated to determine the linewidth. Obviously, for a low noise laser such as the LXM-U, when dealing with observation times close to 1ms, the method leads to 0 since there are no points above the line at frequencies >103 Hz.

Moving Beyond Linewidth
In the evolving landscape of narrow-linewidth lasers, the limitations of linewidth as a singular performance metric have become increasingly apparent. While simple and convenient for initial comparisons, linewidth often fails to capture the full complexity of laser noise profiles, particularly in high-precision applications. The power spectral density of frequency noise (PSDFN) emerges as a superior alternative, offering a comprehensive view of laser performance by integrating frequency noise contributions over a broad spectral range and relevant observation times.
For industries leveraging narrow-linewidth lasers, adopting PSDFN-based characterization methods can lead to better informed decisions and enhanced application outcomes. As laser technologies continue to advance, embracing more nuanced metrics will be key to unlocking their full potential.

- Lax, M. “Classical noise. V. Noise in self-sustained oscillators”, Physical Review, 160(2), 290, 1967. ↩︎
- Di Domenico, G., Schilt, S. & Thomann, P. “Simple approach to the relation between laser frequency
noise and laser line shape”, Applied Optics, vol. 49, no. 25, pp. 4801–4807, 2010. ↩︎ - Bucalovic, N., Dolgovskiy, V., Schori, C., Thomann, P., Di Domenico, G. & Schilt, S. “Experimental
validation of a simple approximation to determine the linewidth of a laser from its frequency noise spectrum”,
Applied Optics, vol. 51, no. 20, pp. 4582–4588, 2012. ↩︎ - Schawlow, A. L. & Townes, C. H. “Infrared and optical masers”, Physical Review, 112 (6), 1940, 1958. ↩︎
- Paschotta, R., Telle, H. R. & Keller, U. “Noise of Solid-State Lasers”, in Solid-State Lasers and Applications,
Edited by Sennaroglu, A., CRC Press, Boca Raton, FL, Chapter 12, pp. 473–510, 2007. ↩︎ - Cliche, J. F., Allard, M. & Têtu, M. “High-power and ultranarrow DFB laser: the effect of linewidth
reduction systems on coherence length and interferometer noise”, in SPIE Laser source and system technology for defense and security II, Vol. 6216, pp. 83-93, 2006. ↩︎
Related Product
| Product | |
|---|---|
| Ultra-Narrow DFB Laser Module – LXM | View product |